Systems Audit - OSQUERY
Intro
Incident detection and response across all hosts and end-points in any organisation requires a deep understanding of actions and behavior across users, applications, and devices. Endpoint detection and protection tools plus powerful audit and visualisation tools can provide deep insight and analysis of security-relevant events crucial to detecting and analysing advanced threats.
Service Overview
OSQUERY - Overview
OSQUERY is an open-source tool originally developed at Facebook that exposes operating system configuration data in the form of relational database tables. By issuing SQL-like queries against these tables, administrators can collect valuable data about the current state of the system as well as changes applied to it over time.
OSQUERY agents are available for all operating systems, including MS-Windows, all Linux flavors, BSDs, MacOS, etc.
Aurora Networks Systems Audit implementation using OSQUERY, plus Host-Based IDS Service, used in conjunction with Graylog centralised logging, represent a security framework that can deliver immediate security outcomes for detection and response.
OSQUERY Features
OSQUERY Tables
OSQUERY collects and aggregates a system’s log and status information in a collection of predefined tables. Users can interrogate the system state with SQL queries against these tables. Queries are issued either through osqueryi, an interactive SQL environment, or osqueryd, a long-lived daemon for execution of repeated, scheduled queries.
Event based tables
The contents of standard tables as described above are populated when a query executes against the table. This model makes it hard to monitor system properties continually. For example, maintaining a list of running processes over time would require a user to schedule a query of the form SELECT * FROM processes at short intervals. Even then, short-lived processes might fall through the cracks.
Event-based tables address this shortcoming by collecting and storing events in near real-time. These tables ensure that events which occur between the defined query interval are collected in the table and purged based on a user-defined expiration option. Any osquery table that ends with _events is an event-based table, for example file_events, hardware_events, and user_events.
OSQUERY Daemon and Logging
osqueryd is the daemonized version of osqueryi, and is used for running scheduled queries. In a standard configuration, you provide osqueryd with a configuration file containing a list of queries together with a schedule. Resultant events are then logged to the filesystem.
OSQUERY supports three different ways of logging events depending on the desired functionality. These logging types are:
Differential: Initial results are cached and future queries will only report changes since the last query. The default logging method for osquery is differential and results from these queries are written to osqueryd.results.log. Differential queries are ideal for understanding when an event has occurred and what changed.
Differential (ignore removals): Same as differential except that only additions to the table will be reported
Snapshot: Query results are not cached and each query will report the current state at the time of the query.
Snapshot queries describe the state of a table at a specific point in time. Results from these queries are written to a separate log file: osqueryd.snapshots.log. Enabling snapshots on a query will return the full contents of a table every time the query runs, regardless of whether or not the results have changed over time.
Query Packs
Query packs are collections of pre-defined queries that often fit into a common category. In the case of auditing windows-based machines, Aurora Networks implements the following packs:
- Windows Processes Audit: System processes, system services, logon sessions (processes and services), interactive user logons.
- Windows Browser Extensions: IE and Chrome extensions.
- Windows Network Audit: ARP Cache, open ports (well-known), open ports (dynamic).
- Windows Security Audit: Windows Update Service Status, Windows Defender Status, Windows Firewall Status, OSSEC agent status.
Kolide Fleet for OSQUERY agents management
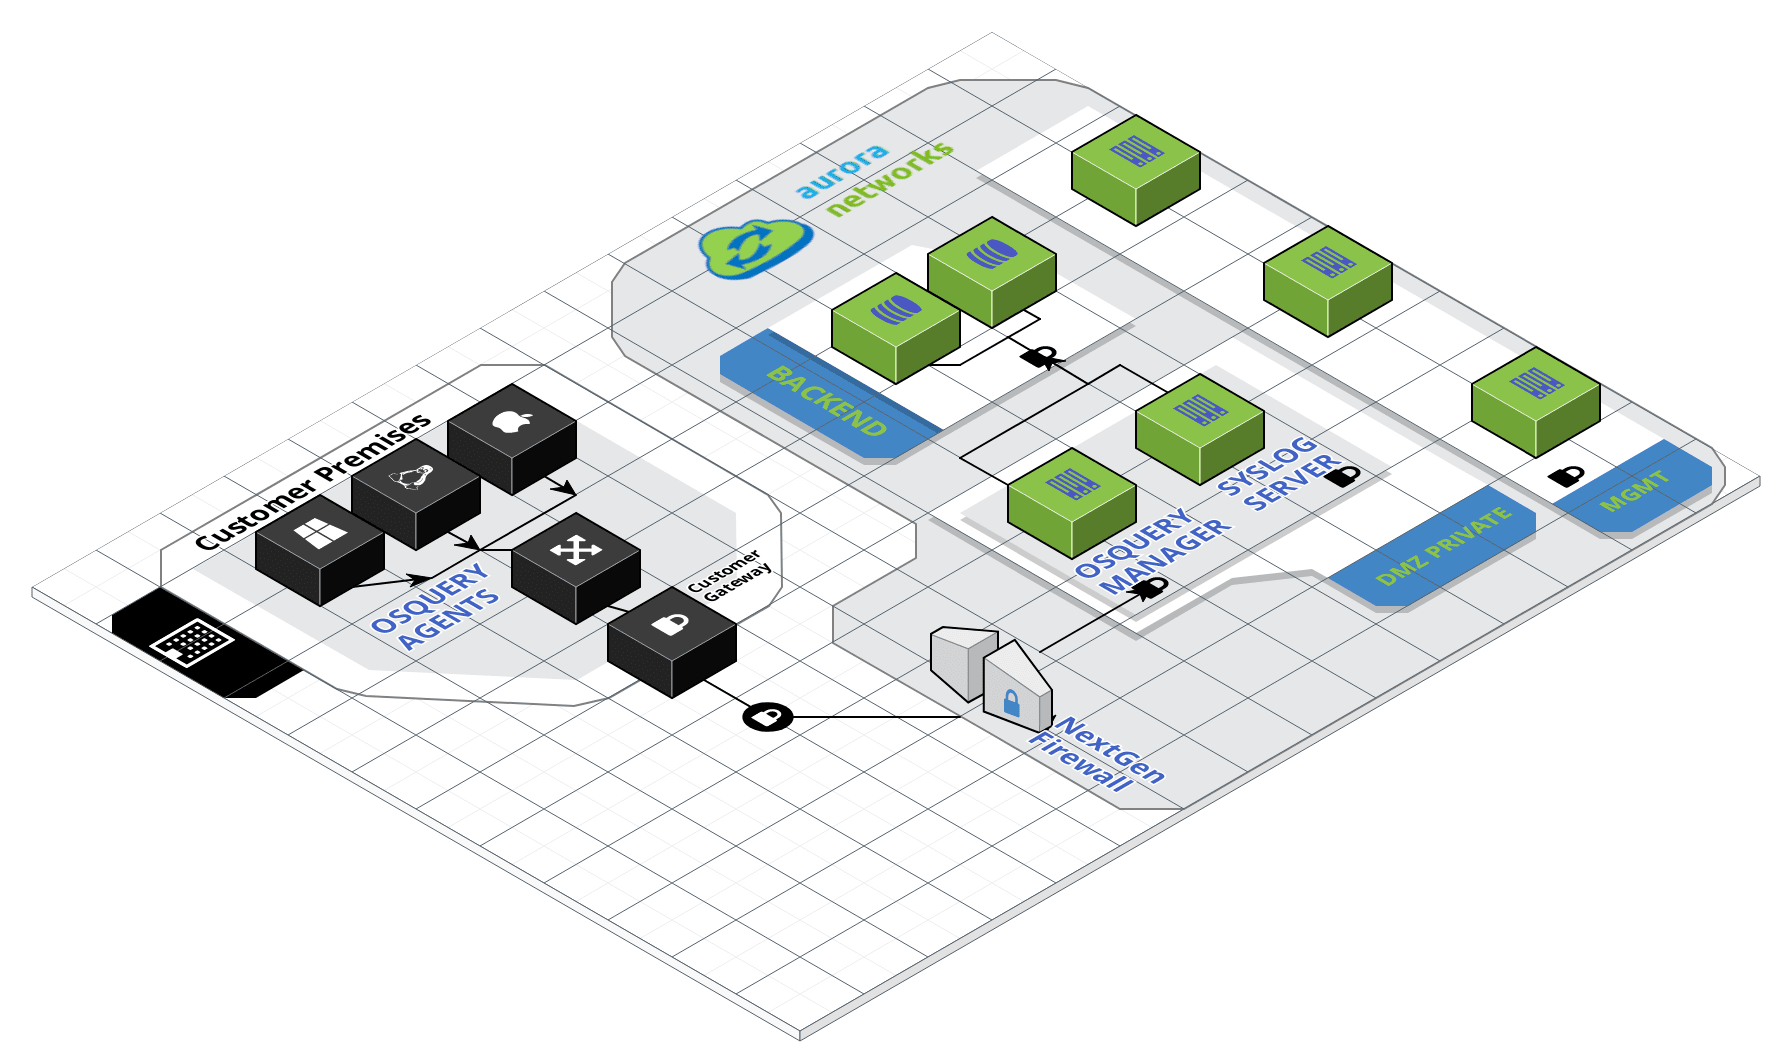
OSQUERY agents register with Kolide Fleet manager hosted in Aurora Networks VPC. End-point to End-point communications (agent to manager) are encrypted using TLS.
On the Kolide Fleet manager is where all the packs and queries, along with their schedule, are configured. The manager instructs each agent to execute the queries and the agent reports back to the manager their outputs.
The Kolide Fleet manager is sending all these results to Graylog for visualisation, analysis, notification and alerting.
Mitre ATT&CK Framework
The Mitre ATT&CK Framework compiles a series of tactics and techniques with constant update from the security community. The ATT&CK knowledge base is used as a foundation for the development of specific threat models and methodologies.
All the queries, packs and audits implemented by Aurora Networks reflect specific techniques as detailed by the framework.
For more info, please visit https://attack.mitre.org/
Firewall Rules
| Source | Destination | Protocol | Port | Direction |
|---|---|---|---|---|
| All OSQUERY Agents | ANMS OSQUERY Manager | TCP (HTTPS) | 443 | Outbound |
Systems Audit Integration in Centralised Log Management
On Graylog’s Enterprise/Views menu the link “Windows Audit by System name” can be found. From there, the first step is typing the hostname (windows short name or NetBIOS name) of the system we want to audit and check against our baseline:

This view has several tabs, covering specific aspects of our audit (query pack).
As an example, the screenshot below shows the content of the “PROCESSES AUDIT” tab where all system processes added to (or removed from) the process table can be analysed:

The first number indicates how many processes have been added or removed from the process table for the time period in the search (8 hours in this case). The search period can be easily extended as required and all values will update instantly.
In this same tab detailed information on each process can also be found:

In this particular case, the column “columns_on_disk” is relevant since it represents a flag indicating if the process started up from disk. Processes where this flag = -1 could represent some type of malware running on the system. This flag is also configured as an alert condition that will trigger a notification (email, slack post in chat room, etc.) if a value = -1 is detected by Graylog.
The last tab is our baseline or benchmark: for each one of our indicators a benchmark against all agents/hosts is carried out and shown in difefrent tables. This benchmark allows us to spot values that could be considered as “unusual” when checked against all other agents.

Systems Audit Integration in Customer Portal
On the customer portal the “Systems Audit” menu provides full visibility on agents, queries and packs and the results of the audit for different time priods.
OSQUERY Agents by Operating Systems:

Queries and Packs:

System Audit:
Once a host has been selected the result of the audit is shown in difefrent tabs. The first one shows general information about the agent (hostname, operating system and version, hardware platform, etc.).

The following screenshot shows the content of the tab “System Processes” as an example. For the selected time period all system processes added to (or removed from) the process table are shown, along with their detailed information.

The last tab is a snapshot taken every hour evaluating the status of some windows services, relevant for security purposes:
- Windows Update Service.
- Windows Defender Status.
- Windows Firewall Status.
- OSSEC agent status.

An alert condition can be configured in Graylog and a notification can be sent out to desired channels if any of the services above is detected as stopped or disabled.