Asset Monitoring
Service Requirements and Dependencies
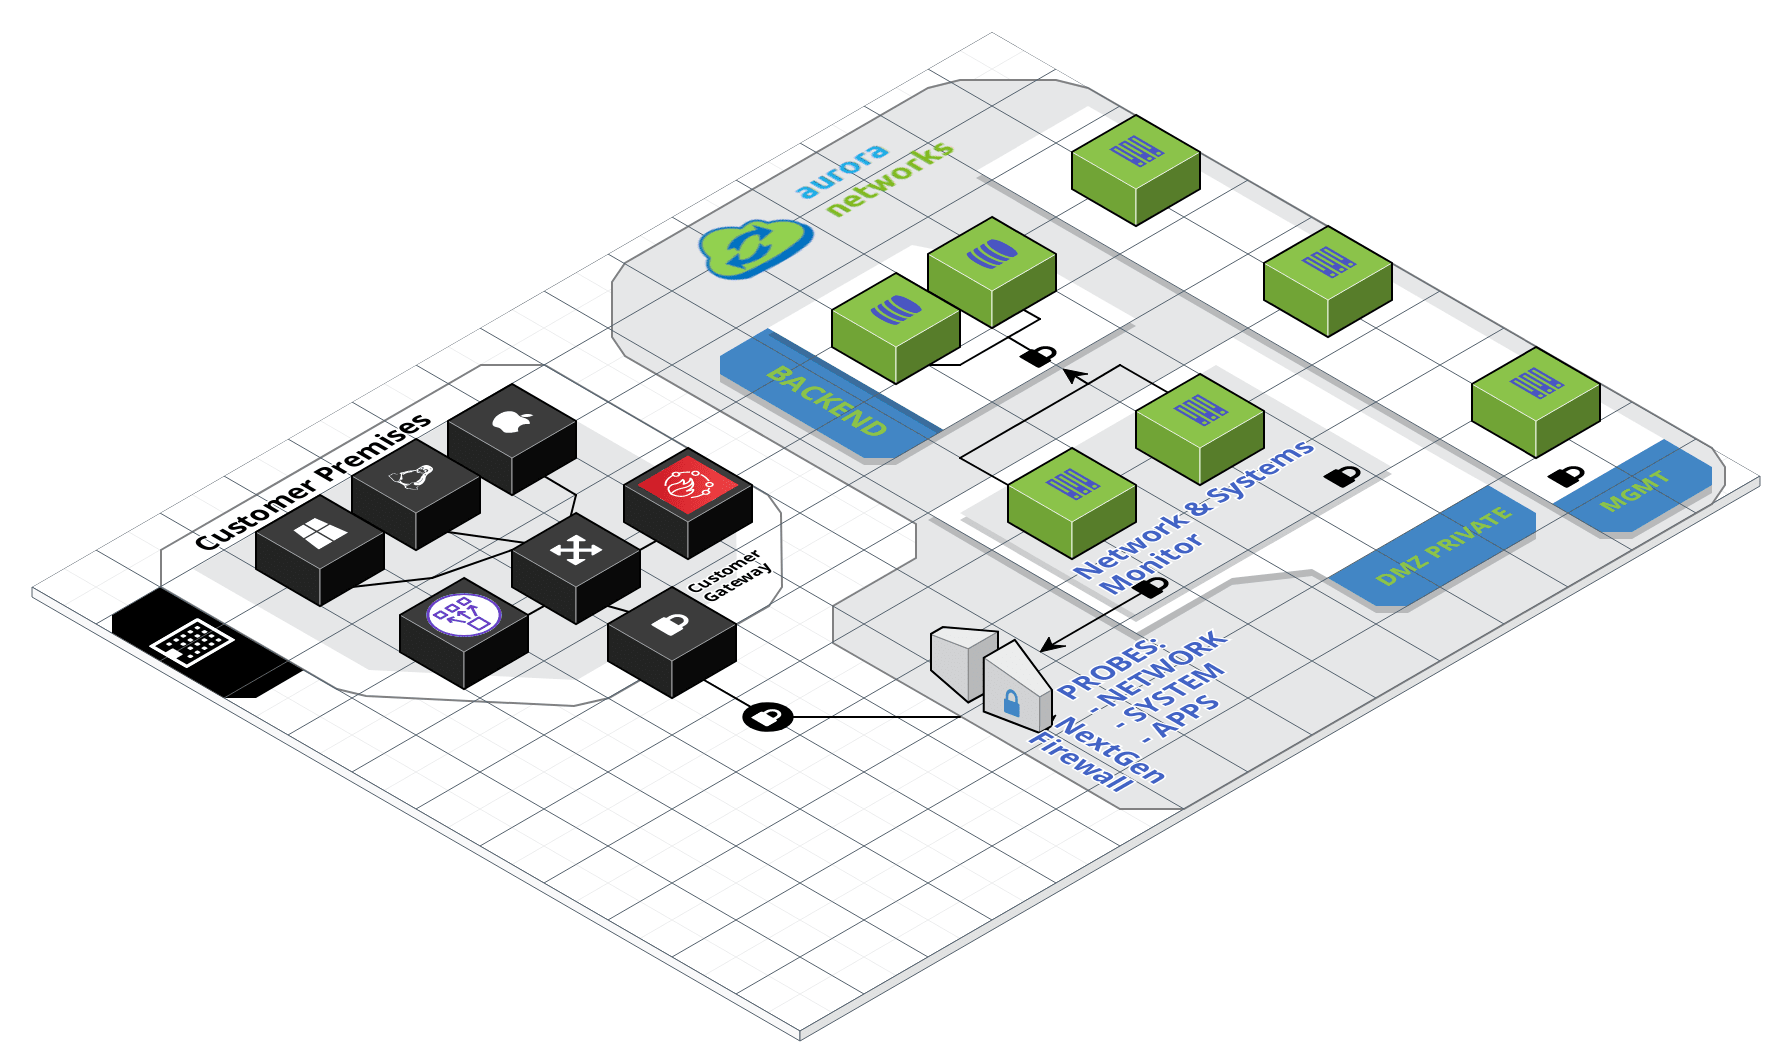
- Secure Tunnel from your Internet Gateway to ANMS VPC.
- DNS Conditional Forwarders configured.
- SNMPv2c/SNMPv3 supported in all network devices and Linux servers.
- WMI enabled in all windows servers.
Service Overview
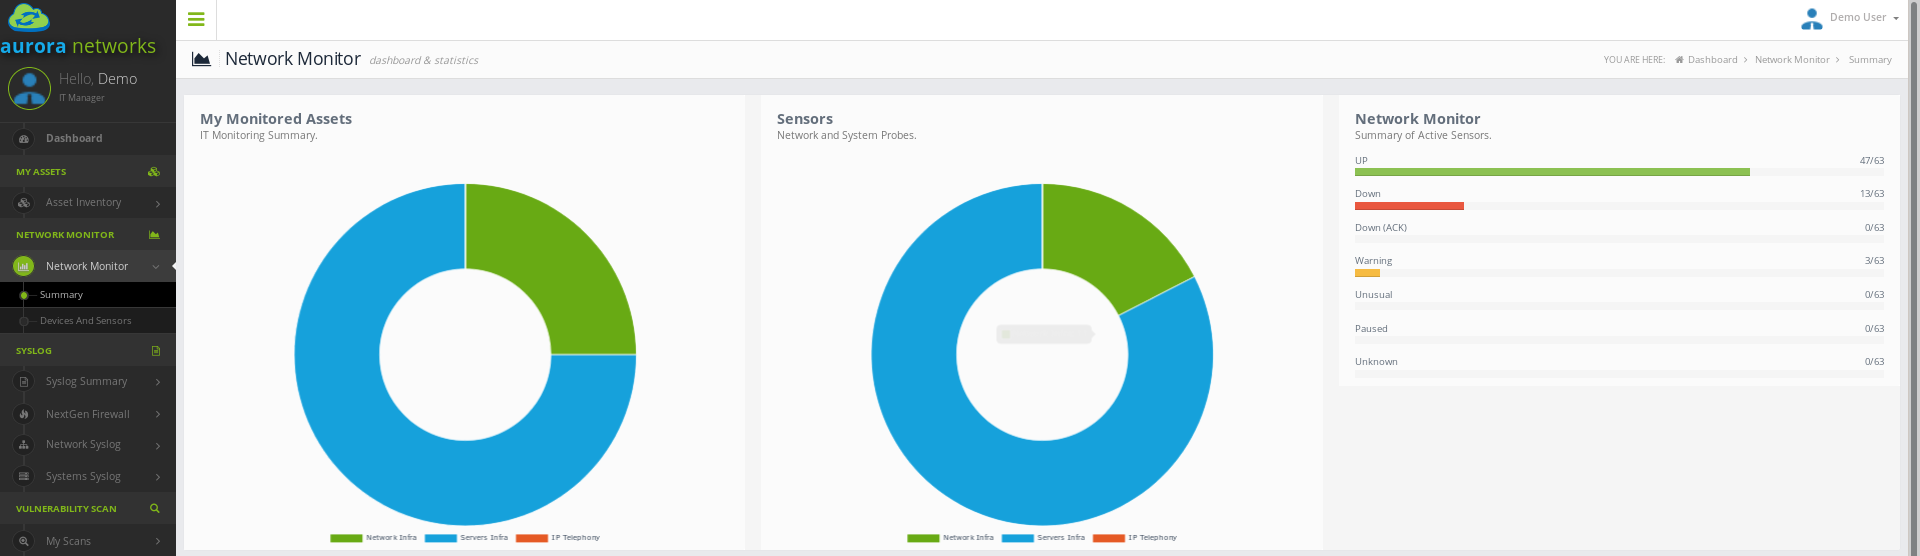
Aurora Networks monitoring system is based on PRTG Network Monitor, implementing an agentless network and systems monitor that can analyse and classify system conditions like bandwidth usage or uptime and collect statistics from systems, network devices and applications.
Main features:
- Monitor all systems, devices, traffic and applications of your IT infrastructure.
- For SNMP-enabled devices, network autodiscovery: This saves you a lot of configuration work and we can start monitoring your infra right away.
- Alerts for warnings or unusual metrics. Notifications via email and slack channels.
Aurora Networks monitoring systems leverage on a wide variety of technologies to scan, discover and monitor your IT Infra: SNMP (all versions), WMI, SQL queries, etc. Network and systems monitoring helps you keep your business healthy.
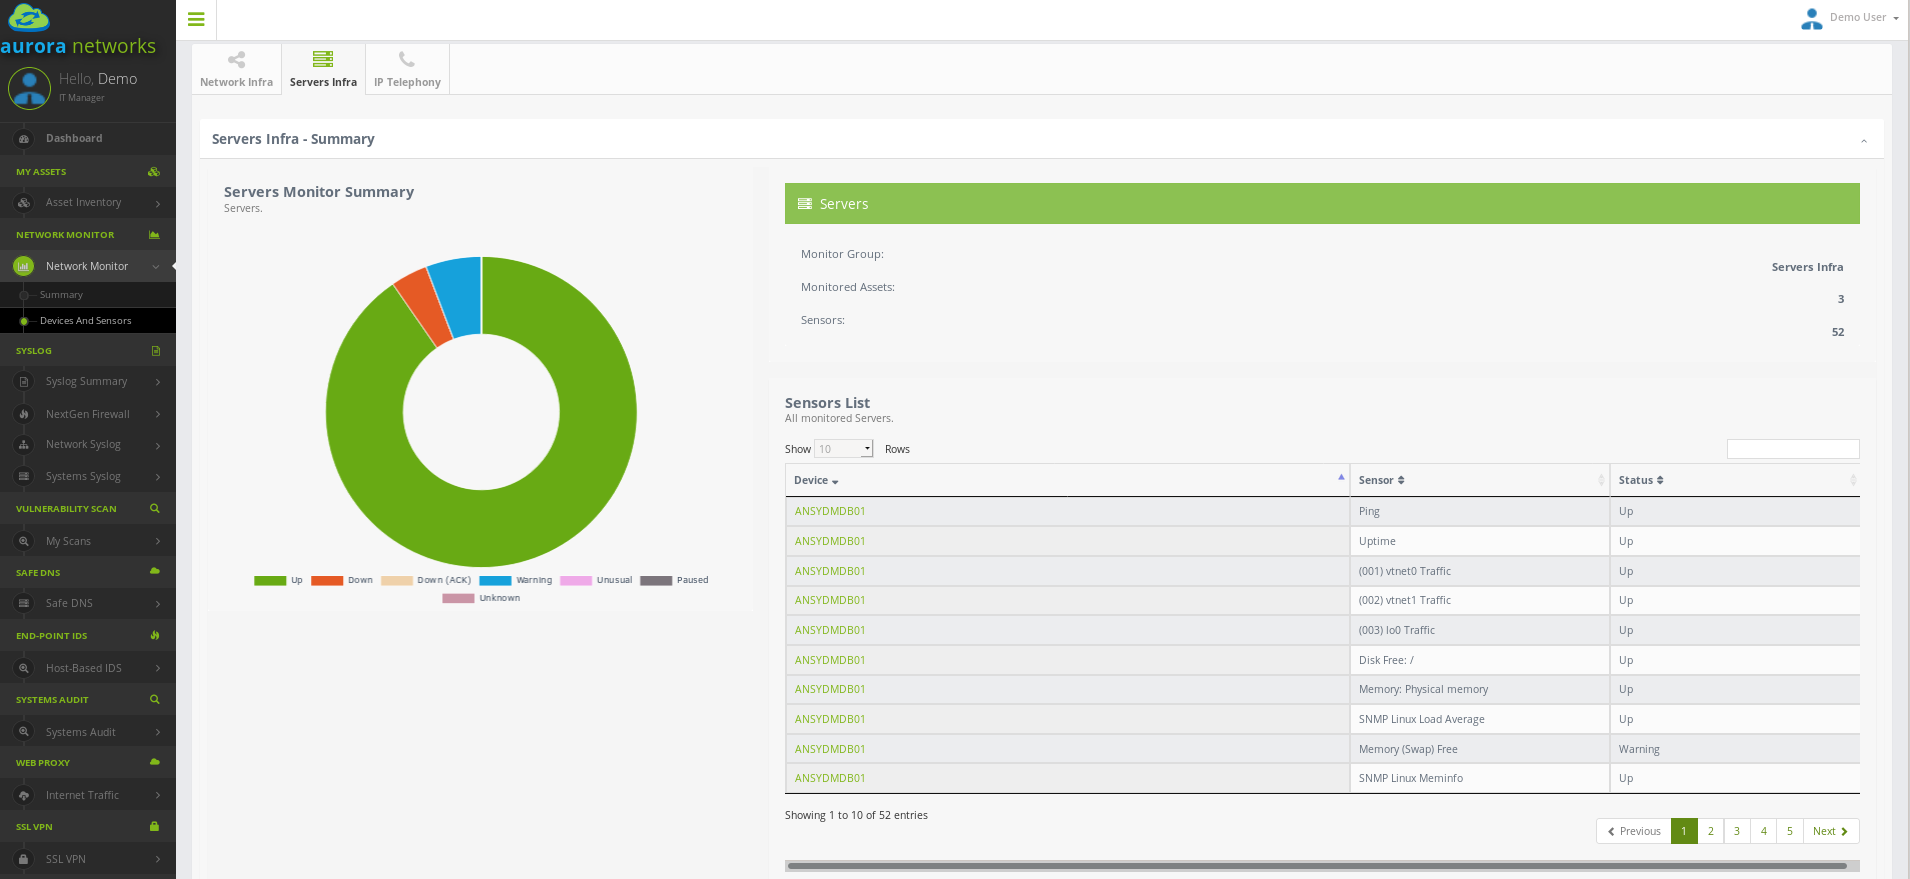
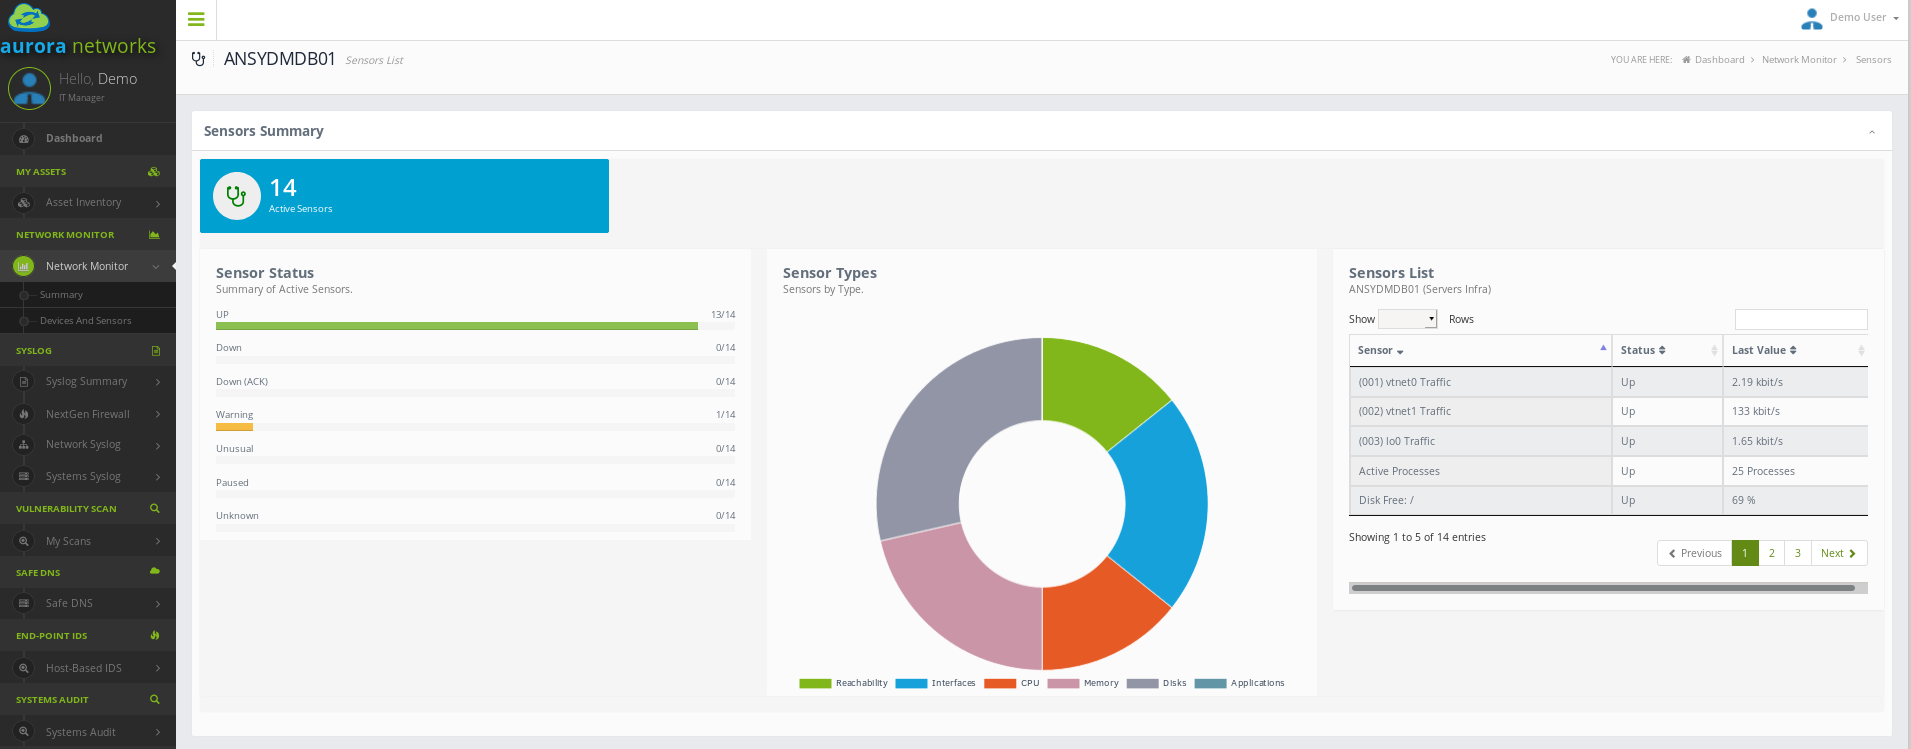
In PRTG, “Sensors” are the basic monitoring elements. One sensor usually monitors one measured value in your network, e.g. the traffic of a switch port, the CPU load of a server, the free space of a disk drive. On average you need about 5-10 sensors per device.
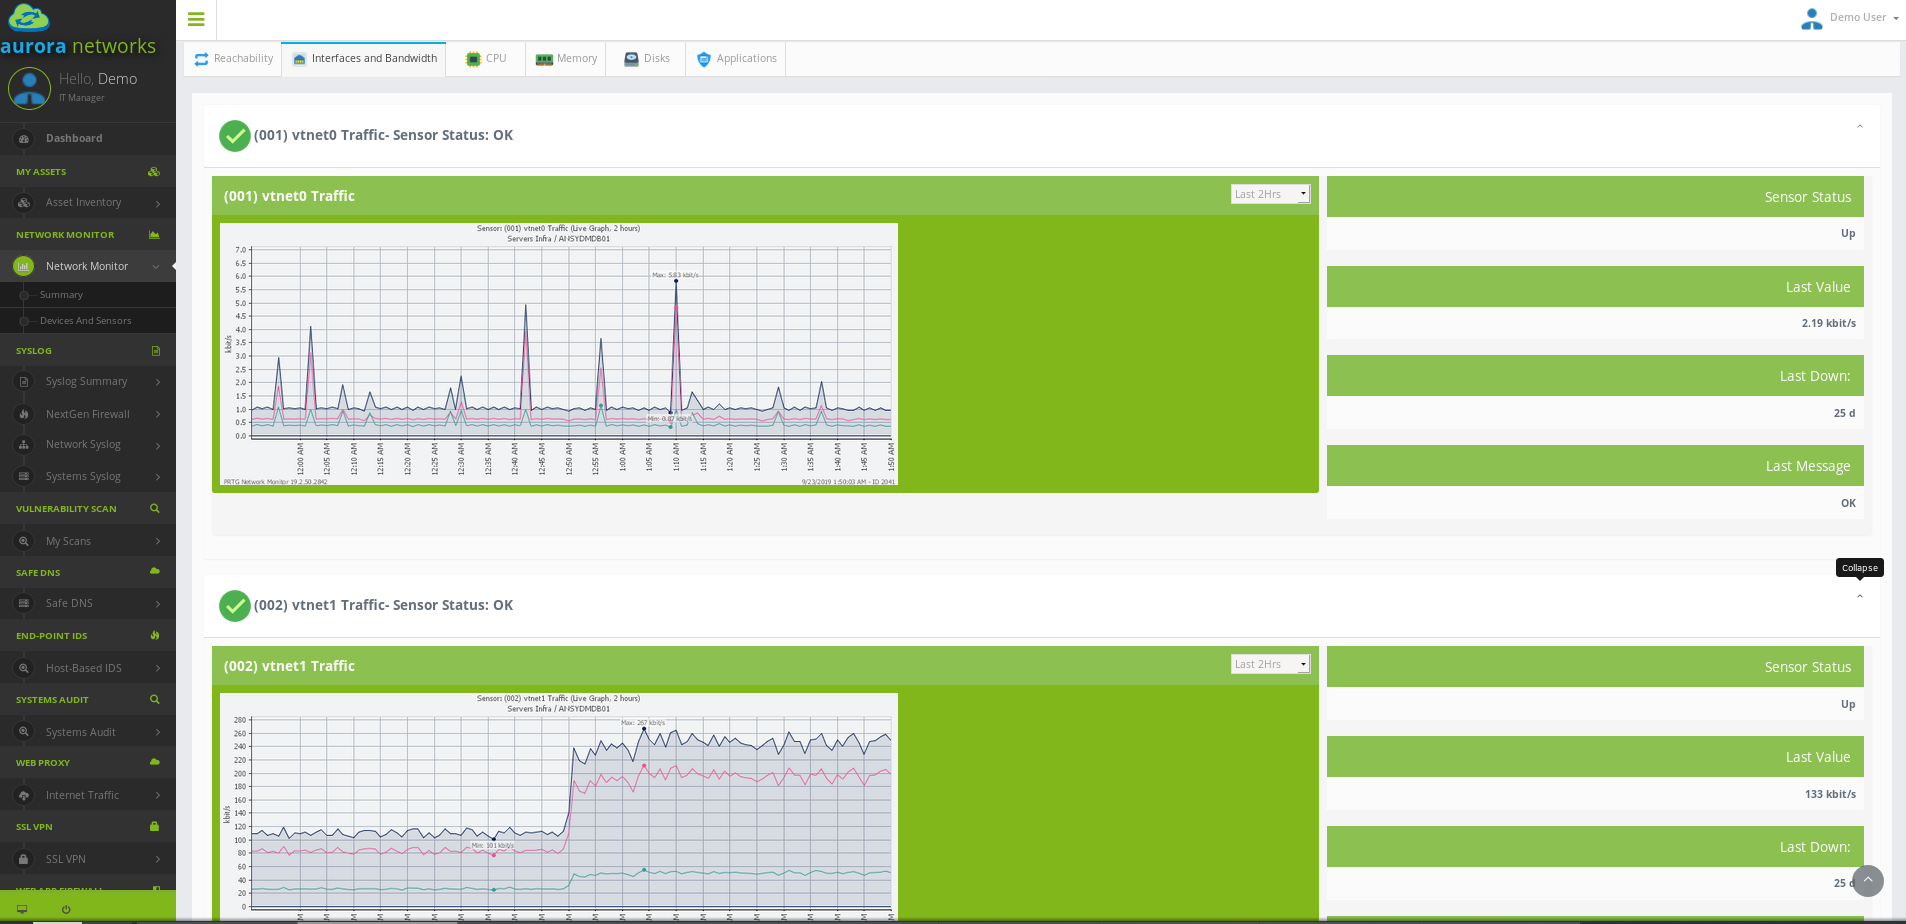
Our monitoring systems collect various statistics from all the machines, software, and network devices at your glance. All colelcted data is stored, so you can see historical performance.
Alerting and notification will allow you to find out when an outage happens, even before your users or customers notice it. We can customise the notification system to suit your needs. Schedule alerts and avoid alarm floods by using dependencies and acknowledging. You can also get alerts when warnings or unusual metrics conditions are triggered.
Network Monitoring via SNMP
With PRTG SNMP network monitor and its integration in our customer portal you’ll get one central monitoring tool with which to monitor your network. The dashboard provides a quick overview at all times.
There are three difefrent versions of SNMP (v1, v2c and v3):
- SNMP V1: Still broadley used today due to its simplicity. Payload encryption is not supported.
- SNMP V2c: SNMP Version 2 is actually named “V2c”. One improvement over v1 is that it supports 64-bit counters, whereas SNMP V1 uses only 32-bit. Payload encryption is not supported.
- SNMP V3: Supports encryption and significantly increases the security of SNMP monitoring. This will be the recommended version to use if supported byu your network devices.
PRTG comes with several preconfigured SNMP sensors and SNMP OIDs developed especially for device manufacturers such as Cisco, HP, Dell, etc. SNMP Custom Sensor can also be defined, so that we can monitor a number of other devices from a variety of different manufacturers or build a customised polling based on specific OIDs. All these features and capabilities will give you a professional SNMP network monitoring solution, with a comprehensive view of your network.
Asset Auto Discovery carrid out by PRTG facilitates provisioning new devices in the tool, or rediscovering existing artifacts if conditions change. With this feature, all SNMP-enabled devices will be automatically included and suitable sensors will be created, automatically. After this initial discovery polling parameters can be adjusted and fine-tuning according to your needs..
In general, network monitoring with SNMP is extremely reliable. PRTG offers many sensors adapted to the various versions (SNMP V1, SNMP V2c, and SNMP V3) and different manufacturers.
SNMP monitoring requires a minimum amount of bandwidth. Also, system CPU and memory impact on targeted devices are is nearly imperceptible, even with broader monitoring including several thousand sensors.
Almost all of the major network and security manufacturers include the Simple Network Management Protocol out of the box.
The Top-5 PRTG sensors for your SNMP monitoring
- SNMP CPU Load: This sensor shows you CPU usage over time.
- SNMP Disk Free: Avaliable disk space.
- SNMP Memory: This sensor shows you how much memory is left.
- SNMP Trafficr: All provisioned ports.
- SNMP Hardware Status: Track down hardware status and device health.
3 steps to SNMP monitoring – This is how easy you configure PRTG!
Check to make sure your devices support SNMP. This should be the case at your company, for SNMP has been a standard for several years for manufacturers such as Cisco, Juniper, HP, and Dell. In this step, PRTG also verifies which SNMP version is supported and discovers automatically all available devices in your network.
Turn on SNMP in the device. There is often a management program or configuration page for this purpose. For many devices, the default SNMP setting is “off.” If there is a firewall between the devices and the PRTG probe, then configure the firewall accordingly. Activate SNMP port 161 and open all outgoing ports greater than 1023 for SNMP on the PRTG side of the firewall.
Create appropriate sensors for the devices in PRTG. The sensor settings must be compatible with the device’s version of SNMP so the data can be read.
MS-Windows Servers Monitoring via WMI
WMI is the Microsoft base technology for monitoring and managing Windows-based systems. PRTG uses this technology to access data of various Windows configuration parameters and status values. However, sensors using the WMI protocol generally have a high impact on system performance. In addition to strict WMI sensors, there are sensors that can use Performance Counters to monitor Windows systems.
To monitor via WMI and Performance Counters, it is usually sufficient to provide Credentials for Windows Systems in PRTG. However, monitoring via WMI is not always trivial and often causes issues.
How WMI Works
WMI allows access to the data of many Windows configuration parameters, as well as current system status values. Access can be local or remote via a network connection. WMI is based on COM and DCOM and is integrated in Windows versions as of Windows Server 2000. PRTG officially supports WMI for Windows 7 or later.
icon-i-round-redWoW64 (Windows 32-bit on Windows 64-bit) must be installed on target systems that run Windows Server 2016. This allows 32-bit applications to be run on 64-bit systems. This is necessary because the probe service only runs with 32-bit support. Without it, WMI sensors will not work.
To monitor remote machines, PRTG WMI sensors need Active Directory account credentials to have access to the WMI interface. You can enter these credentials in PRTG for the parent device or group, or in the Root group. The sensor will then inherit these settings.
icon-i-redSensors using the Windows Management Instrumentation (WMI) protocol generally have a high impact on the system performance! Try to stay below 200 WMI sensors per probe. Above this number, please consider using multiple Remote Probes for load balancing.
Monitoring Windows Systems: Performance Counters
Besides sensor types that can monitor Windows systems only via WMI, PRTG provides sensor types that can use a hybrid approach. If you choose the hybrid approach, these sensors will first try to query data via Windows Performance Counters using Remote Registry Service. These Windows sensors use WMI as a fallback if Performance Counters are not available or cannot be read out. When running in fallback mode, PRTG re-tries to connect to Performance Counters after 24 hours. You can change the Preferred Data Source in the Windows Compatibility Options in the Device Settings.
icon-i-roundYou can identify these hybrid sensors by looking at their categories, for example, in the Add Sensor dialog. Search directly for “windows” and select “Performance Counters” as Technology Used. Among them are various sensors with “Windows” in the name, as well as some Hyper-V sensors.
Basic Requirements
Please ensure the following:
DCOM is enabled on the probe and the target computer. Check the respective registry entry. The user whose credentials are specified for monitoring WMI is a member of the Domain Administrators group in the same Active Directory as the target computer. If a target computer is outside of a domain, the user has to be a member of the local Administrators group and of the DCOM group and of the Performance Monitoring group on this machine. The monitoring user’s access rights on COM and WMI include remote access rights for the target computer. Read about Securing a Remote WMI Connection on MSDN. The target computer’s Windows Firewall is set to allow WMI. MSDN features an article on this topic for XP and W2k3: Connecting to WMI remotely with VBScript. For computers with Vista and later Windows versions, read this article on MSDN: Connecting to WMI on a Remote Computer. If the firewall is enabled by group policies, you have to enable the “Allow Remote Administration Exception” as outlined in this Addicted to IT article: Group Policy: Windows Firewall setting to allow your WMI scripts to run The RPC server that is used for WMI on the target computer is running on the port that is specified in PRTG (135 by default). DCOM and RPC need open high ports in the 49152-65535 range on Windows Vista and Windows Server 2008 or later. In previous Windows versions, ports in the 1024-5000 range are required. Some customers have found that opening TCP port 1091 helped them to get a connection. For more information, see the article Service overview and network port requirements for Windows. To define a more specific port range for DCOM, follow these steps:
Run dcomcnfg to open the DCOM console. Open Components Services - Computers - My Computer. Right-click My Computer and choose Properties from the context menu. Open the Default Protocols tab. Open the Properties… of Connection-oriented TCP/IP. Define the port range you want DCOM to listen at. Set a minimum of 100 ports in the 49152-65535 or 1024-5000 range, depending on the Windows versions in your environment. Security software: It is always a good idea to double-check that no local security software (anti-spy, anti-virus, and others) on either side is blocking WMI connections. If you do not get a WMI connection, try to restart the WMI service manually or change the IP address of the target server to its DNS name in the device settings in PRTG. This establishes a completely new WMI connection, which might help.
Linux/Unix/BSD Servers Monitoring via SNMP
Asset Monitoring
Firewall Rules
Inventorying your IT infra requires bi-directional communication between our VPC in AWS and your own environment. The table below summarises all the required TCP/UDP flows, where “Inbound” means traffic ingressing your premises and “Oubound” means traffic leaving your premisses:
| Source | Destination | Protocol | Port | Direction |
|---|---|---|---|---|
| ANMS Inventory Tools | Your Network Infra | UDP | 161 | Inbound |
| ANMS Inventory Tools | Your IP Telephony | UDP | 161 | Inbound |
| ANMS Inventory Tools | Other Managed Assets | UDP | 161 | Inbound |
| Your Servers Infra | ANMS Inventory Tools | TCP (HTTP) | 8080 | Outbound |
| Your WKST/Laptops | ANMS Inventory Tools | TCP (HTTP) | 8080 | Outbound |
If your perimeter firewall is a NextGen Firewall, application control and specific URL enforcement (for the REST API) can also be added in your rulebase.